Out-of-sample is the only number that matters
May 15, 2026 · The Forven team
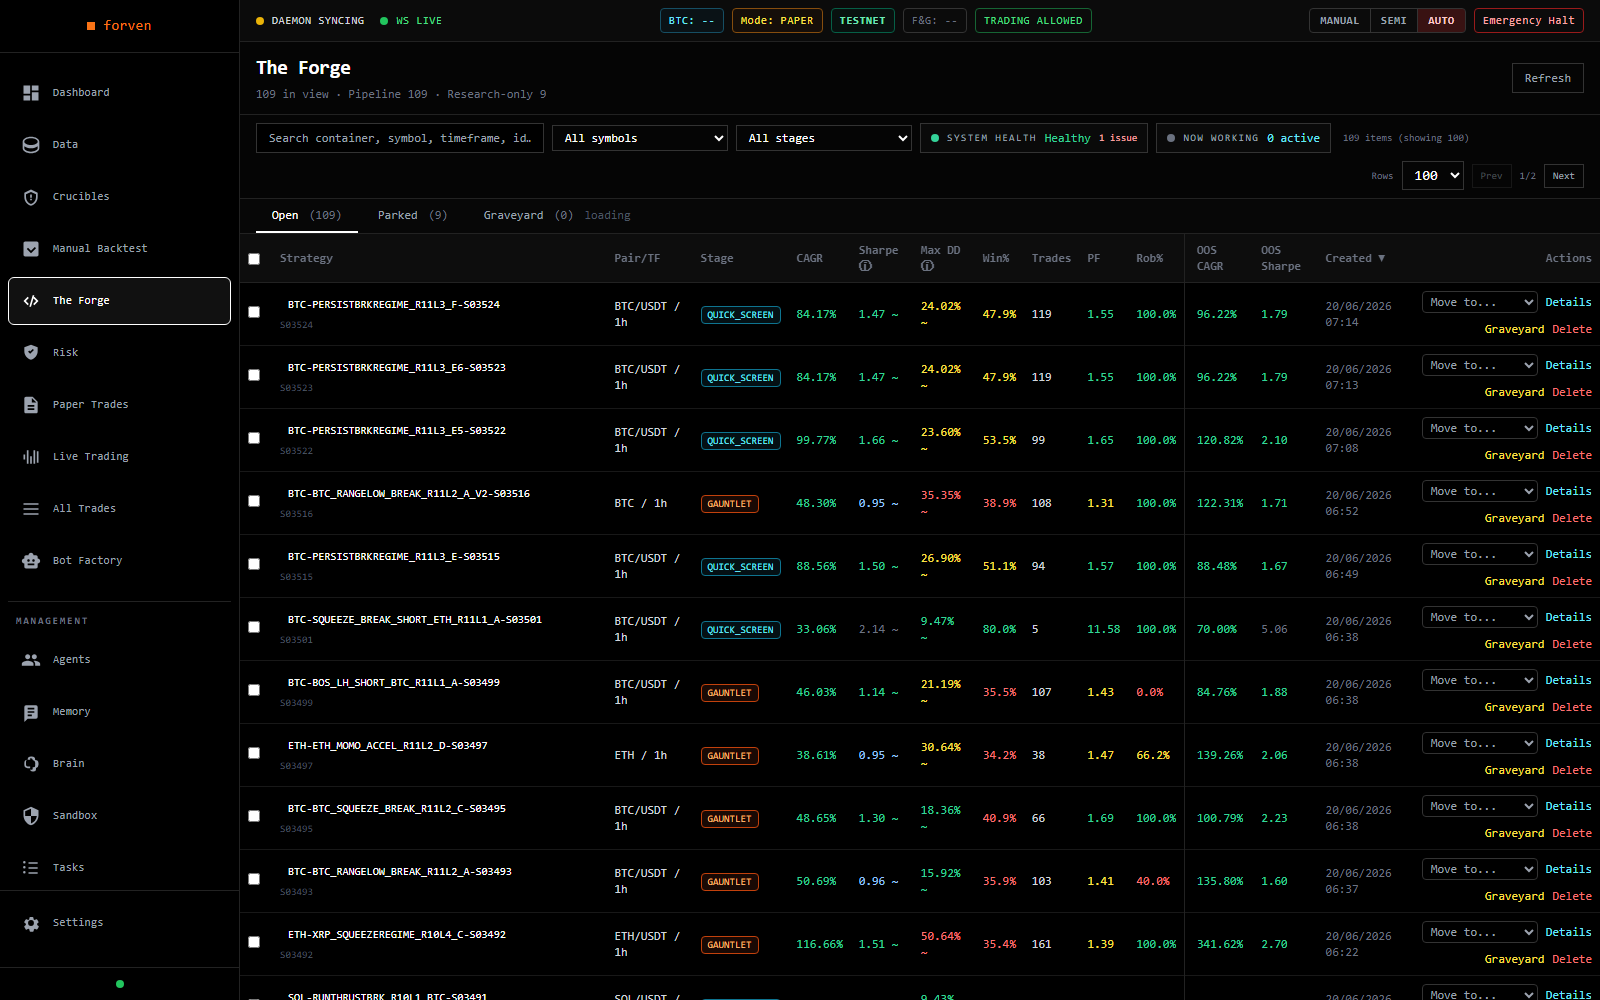
In the lab, every strategy carries its in-sample numbers and its out-of-sample numbers side by side. Read the OOS columns. Illustrative research data from a paper/testnet lab — not returns, not predictions.
You ran a backtest. The Sharpe came back at 2.4. The equity curve climbs like a staircase. You feel something — call it conviction — and you start thinking about size.
Stop. That number is in-sample. It is not a result. It is a story your strategy is telling about data it has already seen, and it is optimistic by construction. The only honest question is what the strategy did on data it had no part in tuning. Forven is built so you cannot avoid asking it.
What in-sample and out-of-sample actually mean
Every backtest Forven runs splits its data 70/30 at a fixed index. The first 70% is in-sample (IS): the window where signals are generated and parameters are tuned. The last 30% is out-of-sample (OOS): held back, unseen during tuning, untouched.
IS metrics describe how well your strategy fit a window it was allowed to study. Of course it fit well — you optimized it there. That is not evidence of edge. It is evidence that your search worked.
OOS metrics describe how the same parameters behaved on data they never saw. That is the only part of the test that resembles the future, because the future is also data your strategy has not seen. So the lab renders the two side by side, and the gates only read OOS. When you read a result, start with the out-of-sample block.
Why a great backtest usually means overfitting
A curve that only ever climbs has often read tomorrow's prices. Sometimes that is a literal look-ahead bug — a stray index into the next bar — and Forven treats suspiciously clean numbers as exactly that: a Sharpe at or above 5.0, or a profit factor at or above 8.0, is auto-rejected as a leak signature rather than celebrated.
More often the overfitting is subtler. You tried forty parameter sets, kept the one with the best backtest, and mistook a lucky coordinate for a real basin of edge. The IS number looks spectacular because you selected it to. The tell is the gap: a strategy that looks excellent IS and poor OOS is overfit, full stop. Forven's quick-screen gate rejects an IS/OOS Sharpe ratio above 3.0 for precisely this reason.
If your backtest looks too good, the right instinct is not pride. It is to go looking for the bug.
Walk-forward: degradation is the measurement
A single 70/30 split is one test, and one test can be lucky. So the gauntlet re-runs the split across multiple folds — five by default — each trained on its first 70% and judged on its last 30%. This is walk-forward analysis, and it is the spine of the whole battery. Drop every other test and the gauntlet still self-heals walk-forward back in, because without it there is no honest out-of-sample signal at all.
The number that comes out is degradation: how much the OOS Sharpe falls short of the IS Sharpe, averaged across folds. A strategy whose edge survives the move from training to test degrades a little. A strategy that was only ever curve-fit degrades a lot. The robustness score is literally 1.0 - max(IS-to-OOS degradation, 0) — it is a direct readout of how much edge you kept when the data turned unfamiliar.
High degradation is the signature of overfitting. It is the most useful thing a backtest can tell you, and it is invisible if you only ever look at the IS column.
The flags that hide numbers you should not trust
Short windows produce metrics that look incredible and mean nothing. Two reliability flags exist to suppress that false confidence:
- Sharpe is flagged unreliable below 20 trades, because annualization scales by the square root of trades-per-year and inflates wildly on thin runs. Below the threshold, the figure is hidden rather than shown with borrowed authority.
- Annualized return is suppressed below roughly 3 months of data. A 25-day run can report a return in the thousands of percent. That is an artifact, not a result.
When a flag is false, Forven hides the number instead of dressing it up. Transparency over confidence — a four-digit return on a three-week window is noise, and pretending otherwise is how accounts die.
None of these numbers, flagged or not, are a forecast. Forven is a research tool. Every metric it reports describes past behavior on historical data; it is illustrative, never predictive, and any figure in this post is an example, not a promise. Survival is evidence of discipline, not of profit. Nothing here is financial advice.
Trust OOS
The pipeline only pays you for stages you actually cleared, and every gate that decides whether a strategy advances reads out-of-sample, never in-sample. You can override a kill. The tool will let you, and it will log that you insisted.
But the discipline underneath is simple enough to keep in one sentence. In-sample is a story. Out-of-sample is the only number that matters — so read that one, and let the rest go.
If you want to watch a strategy survive its own walk-forward, the gauntlet is where it happens.